
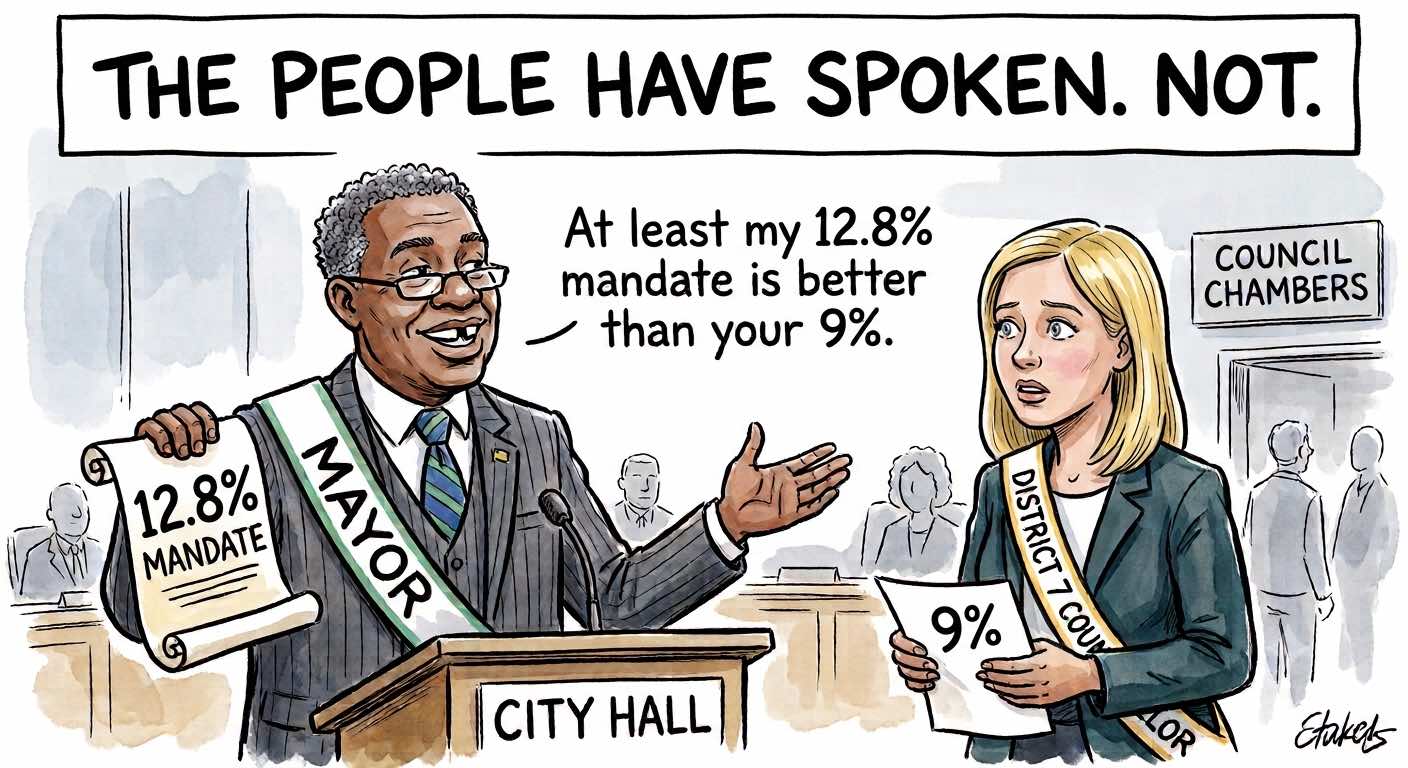

Columbus elected a mayor, four councilors and a school board in 2026. Most of the city sat it out. A councilor took her seat on 1,218 votes, the new mayor takes office on 12.8 percent of the county’s registered voters, and the district-level numbers say the usual explanations for low turnout are wrong.
Rebecca Zajac will be sworn in as the councilor for District 7 in January. She won the seat on June 16 with 1,218 votes.
District 7 has 13,532 registered voters. It has roughly 18,600 residents old enough to vote. So the winner carried 9 percent of the district’s registered voters, and about 6.5 percent of its voting-age population.
Nobody did anything wrong. Zajac ran, she won more votes than Laketha Ashe, and the count was certified by the Muscogee County Board of Elections. That is the whole point. This is what a legitimate, correctly administered municipal election in Columbus looks like right now.
Since the people elected in May and June do not take office until January, there is a quiet stretch ahead of us. It is a decent time to look at what actually happened, before anyone of them has voted on anything.
The Size of the Thing
On May 19, Muscogee County cast 36,977 ballots out of 127,674 registered voters. That is 28.96 percent.
The June 16 runoff drew 31,771 ballots, or 24.88 percent. Five thousand two hundred and six people who voted in May did not come back in June.
Isaiah Hugley won that runoff with 16,313 votes against Joanne Cogle’s 15,317, a margin of 996. He is the first elected Black mayor in the city’s history, in a city that is close to half Black, and that took until 2026. Both of those facts are worth sitting with at once. He will run a city of about 200,000 people on the strength of 16,313 votes, which is 12.8 percent of the county’s registered voters.
What the Coverage Got Wrong About Who Voted
After the May election, the turnout numbers were reported with a racial breakdown: Black voter turnout at 14.1 percent, white voter turnout at 11.2 percent.
Those are not turnout rates. As published, there were 18,011 Black voters against 127,710 registered voters, and 18,011 divided by 127,710 is 14.1 percent. There were 14,354 white voters, and that divided by the same 127,710 is 11.2 percent. Both are shares of the entire registered electorate. Neither says what portion of Black or white voters showed up.
The state’s own registration data for Muscogee County lists 55,955 active Black voters and 48,417 active white voters. Against those denominators, the real rates are about 32 percent and about 30 percent.
A reader who saw 14.1 percent would conclude that roughly one Black voter in seven turned out. It was closer to one in three.
The direction was never in dispute. Black turnout ran ahead of white turnout in both versions. What the published figures got wrong was the scale, by a factor of two and a half, in a story whose whole subject was how few people voted. The counts behind them were the unofficial day-after numbers, which is why those totals run slightly below the certified ones used elsewhere here.
The same arithmetic turns up something nobody has reported at all. Hispanic voters in Muscogee turned out at 15.5 percent and Asian or Pacific Islander voters at 15.8 percent, roughly half the Black and white rates. Both groups are small on the county rolls, 3,770 and 2,264 registered voters, so those percentages move easily and should be read with that in mind. They are still the lowest participating groups in the county by a wide margin.
Who Voted, by District
Here is the part that has not been published anywhere, because it required building it.
The county’s certified reports give ballots cast and registered voters for every district that had a contest on the ballot. The city’s GIS office publishes the district boundaries. The Census Bureau publishes 2020 population down to the block. Put those three together and you can see each district’s demographics next to its actual participation.
| District | Black share of voting-age pop | Registered | Ballots May 19 | Turnout |
|---|---|---|---|---|
| Council 1 | 62.6% | 16,495 | 5,099 | 30.91% |
| Council 3 | 78.6% | 15,707 | 3,971 | 25.28% |
| Council 5 | 28.5% | 15,850 | 4,431 | 27.96% |
| Council 7 | 54.8% | 13,532 | 2,643 | 19.53% |
| School 2 | 15.5% | 18,662 | 6,151 | 32.96% |
| School 4 | 80.0% | 16,115 | 5,379 | 33.38% |
| School 6 | 27.8% | 18,194 | 6,507 | 35.76% |
| School 8 | 25.2% | 14,420 | 3,870 | 26.84% |
Look for the racial pattern. It is not there.
School board District 4 is 80 percent Black by voting-age population and had the second-highest turnout in the county. Council District 3 is 78.6 percent Black and turned out below Council District 5, which is 28.5 percent Black. Council District 1 is 62.6 percent Black and had the best turnout of any council district on the ballot. School board District 8 is three quarters white and finished near the bottom.
If somebody tells you Columbus has a Black turnout problem, they have not looked at the districts.
The Gap Starts Before Election Day
Something else runs straight down that table, and it is not race.
The two districts where more than 92 percent of adults are registered turned out at 33 percent and 36 percent. The two districts where registration sits at 72.6 percent turned out at 19.5 percent and 26.8 percent. That relationship holds across both maps, the council one and the school board one, which are drawn differently and were adopted separately.
Council District 7, the one that gets a councilor on 1,218 votes, has the lowest registration rate of any council district that voted this year. More than a quarter of the adults living there are not on the rolls at all. Then, among those who are, fewer showed up than anywhere else.
Two gaps, stacked. By the time you are counting ballots you are already counting the second one.
That reframes the question in this article’s title. Part of “why don’t people vote” is “why aren’t people registered,” and those have different causes and different remedies. Registration is a paperwork problem with known fixes. Turnout is a motivation problem. Columbus has been treating the second as though it explained the first.
Nobody Came Out for the Council Race
Something else separates these districts, and it is not race. It is whether people are on the rolls in the first place.
School board districts 2 and 6 have more than 92 percent of their adults registered. They turned out at 33 and 36 percent, the two best figures in the county. Council District 7 and school board District 8 both sit at 72.6 percent registered. They turned out at 19.5 and 26.8 percent. That relationship holds across both maps, the council one and the school board one, which are drawn differently and were adopted separately.
Add up the four districts that had a council seat to fill: 16,144 ballots from 61,584 registered voters, or 26.21 percent.
Now the four districts with no council race: 20,833 ballots from 66,090 registered voters, or 31.52 percent.
The half of the city with a city council seat on the line turned out more than five points lower than the half with nothing local to decide beyond mayor.
Be careful with that. The even-numbered districts also happen to include the higher-registration parts of town, so this is not a clean experiment and I am not claiming the council race drove people away. What it does rule out is the comfortable story, which is that a local election brings local people out. In Columbus in 2026 it did not.
What Actually Brought People Out
Georgia holds its state primary in May, and Columbus holds its nonpartisan municipal elections the same day.
That is the whole mechanism. In May, 23,799 people pulled a Democratic ballot and 11,481 pulled a Republican one. The mayor’s race was printed on those ballots. In June, the runoff ballot carried a Democratic runoff for Labor Commissioner that drew 17,814 voters and a Republican runoff for Public Service Commission that drew 12,307. Between them that is very nearly the 31,771 people who turned out to pick a mayor.
Municipal turnout in Columbus is a passenger. The vehicle is the state primary.
This also explains something that looks strange in the results. Early voting in May ran 15,561 Democratic to 4,994 Republican, and 12,416 Black voters to 6,646 white. Election day flipped: 8,071 Republican to 6,421 Democratic, 7,641 white to 5,475 Black. Two different electorates voted in the same election on different days.
You can watch that decide the mayor’s race. Cogle won election day 10,071 to 6,523. Hugley won early voting 9,014 to 4,761 and absentee ballots 772 to 485. He won by 996 votes.
The Winner Did Not Gain a Single Vote
In May, Hugley received 16,325 votes. In the June runoff, he received 16,313.
He finished twelve votes below where he started.
Cogle went from 9,189 to 15,317, picking up about 56 percent of the 20,204 votes that had gone to the four eliminated candidates. She consolidated most of the field and still lost, because 5,206 May voters did not return.
So the historic result and the turnout collapse are the same event. Hugley did not win by persuading anyone new. He won because his support was durable and the electorate shrank around it.
Showing Up Is Not the Same as Voting
One more thing the certified reports show, which nobody talks about.
Of the 36,977 people who cast a ballot in May, 448 skipped the mayor’s race. That is small. But 1,338 skipped the at-large council seat, 2,208 skipped the at-large school board seat, and 4,592 skipped the State Court judge, who was running unopposed. Twelve percent of the people who showed up left that line blank.
There was also a quirk worth noting, because it is a small measurement of how confusing the ballot was. District 9 appeared twice, once for a full term and once as a special election for an unexpired term, with the same two candidates both times. The results are not identical. In May, John Anker got 161 more votes in one version than the other, and Cathy Cook got 83 fewer. In June, Anker was 95 votes higher in one and Cook 106 lower. A few hundred people voted differently in two contests that were the same contest.
What It Means in January
Hugley takes office with a mandate from 12.8 percent of the county’s registered voters. Zajac takes a council seat on 6.5 percent of her district’s adults. Cathy Cook unseated an incumbent at large with 18,683 votes.
None of that makes them illegitimate. It makes them fragile.
A decision made by a body elected this way is easy to contest later, and Columbus has just spent a year watching exactly that happen. The ordinances nobody explained, the overlay that produced a lawsuit from eight Upatoi residents, the rules that turned out not to exist. In every one of those fights, one side eventually said some version of “nobody asked us.” At 24.88 percent, that claim is close to true by arithmetic, whatever anyone intended.
The lull runs until January. The people who will make the next round of those decisions have already been chosen. Almost nobody chose them.
A Note on the Numbers
Turnout, registration and vote totals come from the Muscogee County Board of Elections certified results for May 19 and June 16, 2026. Countywide demographic breakdowns of the May electorate come from published county election figures.
District demographics were built for this article. Council and school board boundaries came from the Columbus Consolidated Government GIS server. Population came from the 2020 Census redistricting file, assigned district by district using all 3,209 census blocks in Muscogee County. As a check, the assigned population plus the population falling outside every council district equals 206,922, the county’s official 2020 count, and the eight council districts come out within 800 residents of each other, which is what an equal-population redistricting should produce.
Turnout by race was calculated from the Secretary of State’s active voter registration figures for Muscogee County, which total 121,857. That snapshot sits 4.6 percent below the 127,674 voters on the roll at certification, so the rates given above are slightly overstated. Scaling the denominators up to the larger roll gives about 30.7 percent for Black voters and 28.3 percent for white, and leaves the difference between the two unchanged. Georgia records self-reported race at registration and voter history is public, which is why it is possible to say how many voters of each race cast a ballot. It is never possible to say how they voted. Ballots are secret, and tally sheets report candidate totals by precinct with no demographic breakdown at all. Nothing in this article should be read as describing which candidates any group supported.
Two limits are worth stating. Voting-age population is from 2020 while registration is from 2026, and voting-age population includes people who cannot register, so registration rates are approximate and should be compared between districts rather than read as exact. And turnout for council districts 2, 4, 6 and 8 cannot be separated individually, because those districts had no council contest of their own. Their combined figure is exact. The individual ones would have to be estimated, so they are not reported here.
