Physical Address
304 North Cardinal St.
Dorchester Center, MA 02124
Physical Address
304 North Cardinal St.
Dorchester Center, MA 02124

New 2026 data shows Columbus ranks above the state average for both violent and property crime — but a sharp north/south split, and a five-year decline, complicate the picture.
PUBLIC SAFETY · GEORGIA
New 2026 data shows Columbus ranks above the state average for both violent and property crime — but a sharp north/south split, and a five-year decline, complicate the picture.
Columbus, Georgia’s third-largest city, lives in an awkward middle. It is not the state’s most dangerous place, but it consistently posts violent and property-crime numbers above both the Georgia and national averages — and a closer look at recent 2026 data shows why the picture is more nuanced than the headline numbers suggest.
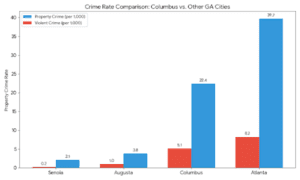
When stacked against its big-city peers, Columbus generally sits in the middle of the pack: safer than the most troubled stretches of Atlanta or Macon, but well above smaller metros like Augusta and Savannah. The latest figures put Columbus’s violent-crime rate at roughly 5.1 per 1,000 residents and its property-crime rate at about 22.4 per 1,000 — compared with Atlanta’s 8.2 and 39.7, Augusta’s 1.0 and 3.8, and Senoia’s 0.2 and 2.1, the safest community in the comparison set.
| City | Violent Crime | Property Crime |
|---|---|---|
| Senoia (Safest) | ~0.2 | ~2.1 |
| Augusta | ~1.0 | ~3.8 |
| Columbus | ~5.1 | ~22.4 |
| Atlanta | ~8.2 | ~39.7 |
That positioning earns Columbus a sobering distinction: statistically, more than 89% of Georgia communities have a lower crime rate. In recent 2026 safety reports, the city ranked around the 36th most dangerous in the United States for its size, putting it in a risk-profile cluster that includes Savannah and Augusta.
One factor analysts repeatedly flag is what locals call the “Fort Benning effect.” As home to one of the Army’s largest installations, Columbus carries a significant transient population, and the constant churn of soldiers, contractors and military families can skew the per-capita numbers in ways that don’t show up in static suburbs like Milton or Johns Creek.
Within those totals, the type of crime matters. Property crime — theft, burglary and motor-vehicle theft — is by far the most common issue, occurring about 4.4 times as often as violent crime. Residents face roughly a 1-in-35 chance of being victimized by a property-related offense in a given year. Violent crime has been a real and persistent challenge, with elevated homicide and aggravated-assault numbers, but Columbus still trends safer than the high-density, gang-impacted pockets of South Atlanta and Macon.
Inside the city, “the crime rate” is really a tale of two Columbuses. The citywide averages disguise a sharp geographic divide between the north and south sides — and understanding that split is the key to understanding the data.
Above J.R. Allen Parkway, North Columbus posts numbers that would be at home in Georgia’s safest suburbs. Neighborhoods such as Green Island Hills, Brookstone, and Old Post Road see violent crime only rarely and property crime well below the state average. Push out to the semi-rural northeast — Upatoi and Midland — and the figures fall further still, consistently ranking as the safest pockets in all of Muscogee County.
Recent analytics name Upatoi, Green Island Hills, Brookstone, and Maple Ridge as the four safest neighborhoods in the city for 2026, citing low density, golf-course living, gated access, or active neighborhood-watch programs as recurring themes.
The picture changes in Midtown — historic enclaves like Lake Bottom, Overlook, and Weracoba Park — where charm comes paired with a higher rate of “crimes of opportunity,” especially car break-ins. It changes more dramatically in South Columbus, where the Cusseta Road area and the Victory Drive corridor account for the bulk of both violent and property incidents reported each year.
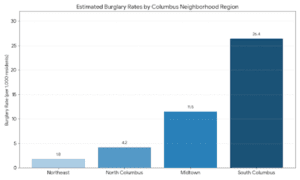
| Region | Burglary Rate | Risk Level |
|---|---|---|
| Northeast | 1.8 | Minimal |
| North Columbus | 4.2 | Low |
| Midtown | 11.5 | Moderate |
| South Columbus | 26.4 | High |
The numbers on burglary alone tell the story. Estimated rates climb from 1.8 per 1,000 residents in the Northeast and 4.2 in North Columbus to 11.5 in Midtown and 26.4 in South Columbus — meaning a South Columbus resident is statistically about 14 times more likely to experience a burglary than a neighbor in Upatoi or Midland. Police note that a striking share of those offenses are crimes of opportunity, involving unlocked doors, open garages, or unsecured ground-floor windows. The local mantra — “lock it or lose it” — applies even in the safest pockets.
Downtown Columbus, branded as Uptown, has seen substantial revitalization and now feels safe during the day and early evening thanks to dense foot traffic and a visible police presence. It remains, however, a hotspot for theft from motor vehicles.
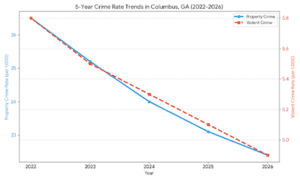
The encouraging news is the trajectory. Over the past five years, both major crime categories have moved in the right direction. Violent crime has fallen from 5.8 to 4.9 per 1,000 residents, a 15.5% decline, while property crime has dropped from 26.5 to 22.4 — a 15.4% improvement. The current property rate still implies roughly 1 in 45 residents will experience a property crime in a given year, but the curve is bending.
Officials and analysts credit three forces. First, technology: the city’s expanding network of license-plate readers and a public-private camera-sharing initiative routed through a Real-Time Crime Center. Second, more focused community policing in South Columbus hotspots, including targeted gang task-force operations. Third, broader economic stabilization since 2022 and continued growth of the healthcare and tech sectors downtown.
For residents who want to drill down further, the Columbus Police Department feeds incident-level data into both the LexisNexis Community Crime Map and its own NIBRS data portal — meaning anyone can look beyond the citywide averages and see what is actually happening on their street.
Columbus, in other words, is not the safest mid-size city in Georgia, and the data confirms the work that remains. But the trend lines — and the geography — suggest a more hopeful story than the headline numbers alone would tell.